Examples in R programming
กก
**********************************************************************************************************************
How to
call Fortran program in R
Environment of my computer: Window XP, Compaq Visual Fortran 6.5,
R2.7.2 (2008-08-25)
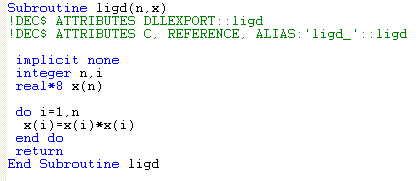
- Compile a Fortran program, and make sure there is no error. The
following file is saved as "C:\temp\example.f90".
 |
Subroutine ligd(n,x)
!DEC$ ATTRIBUTES DLLEXPORT::ligd
!DEC$ ATTRIBUTES C, REFERENCE, ALIAS:'ligd_'::ligd
implicit none
integer n,i
real*8 x(n)
do i=1,n
x(i)=x(i)*x(i)
end do
return
End Subroutine ligd |
The following two lines in the above example are compulsory:

- Open DOS windows, and use the line,
 , to generate the file "example.dll". Note that it will
also generate other files, but only "example.dll" is useful for R.
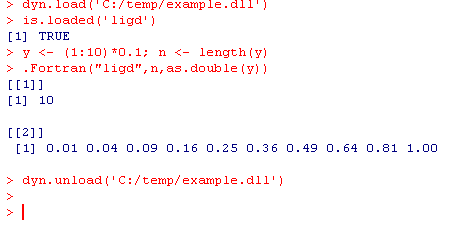
- In the following R program, "dyn.load" is used to load the
Fortran subroutine, "is.loaded" is used to check whether the subroutine
is loaded, "dyn.unload" is used to unload the Fortran subroutine.
Finally, the vector "y" is updated by ".Fortran", and hence stores the
returned data.

Some other related webpages:
using
external compiler with R at UWO, Canada (D. Murdoch's webpage),
calling C &
Fortran from R at UMN, USA (C. Geyer's webpage),
calling
Fortran function from R at Acadia University, Canada,
how
to Fortran 95 code in R at Gunnar's blog, Denmark
**********************************************************************************************************************
Some
examples in R plot
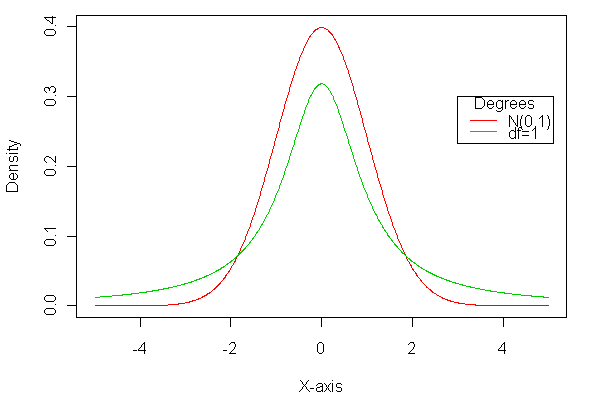
Example 1:
| Programs: |
X <- c(1:1000)*0.01-5; Density <- dnorm(X); T1 <-
dt(X,1);
plot(x=X,y=Density,type='l',xlab="X-axis",ylab="Density",xlim=c(-5,5),ylim=c(0,0.4),col='2');
lines(x=X,y=T1,col='3');
legend(3,0.3,c("N(0,1)","df=1"),col=c(2,3),lty=c(1,1),title="Degrees") |
| Output: |

|
**********************************************************************************************************************
Some interesting R
programs
Example 1: This example is used to draw a
scatterplot-like picture to check the latest exchange rates of several
important currencies.
library(tseries)
Exchange.Rate <- function(currency=c('USD','EUR','JPY'),days=100){
tempy <- c(0,1); tempx<-c(0,1)
par(mfrow=c(length(currency),length(currency)),mai=c(0.01,0.25,0,0))
for(i in 1:length(currency)){
for(j in 1:length(currency)){
if(i==j){plot(y=tempy,x=tempx);
text(0.5,0.5,paste(currency[i],'to(row)'))}
else{
temp.curr <- paste(currency[i],'/',currency[j],sep='')
x <- get.hist.quote(instrument = temp.curr, provider =
"oanda",start = Sys.Date() - days)
plot(x,xlab='',ylab='')
}}}
par(mfrow=c(1,1))
}
Example 2: This example is used to draw a plot
for a stock with closing price and volume.
library(tseries)
Stocks <- function(stock='0005.HK',days=100){
x <- get.hist.quote(instrument=stock,provider='yahoo',
quote = c("Close","Volume"),
start = Sys.Date() - days)
x$Volume <- x$Volume/1000000
plot(x,main=stock)
}
Stocks('0005.HK',100); Stocks('1088.HK',100); Stocks('^HSI',100);
**********************************************************************************************************************
กก


 , to generate the file "example.dll". Note that it will
also generate other files, but only "example.dll" is useful for R.
